Prometheus Agent
Versions Supported
- 19.0.x
Configure the Prometheus Agent Pack
The Prometheus agent supports all the parameters exposed by the Prometheus Helm Chart. Refer to the Prometheus Helm Chart documentation for details.
From a Palette perspective, you must provide a value for the remoteWrite.url parameter shown in the following example.
charts:
  prometheus:
    server:
      remoteWrite:
        - url: ""
The remoteWrite.url is exposed by the Prometheus Operator pack when installed in a cluster.
You can find the Prometheus server URL by reviewing the details of the Kubernetes cluster hosting the Prometheus server.
Use the URL exposed by the Prometheus service.
The following image displays a host cluster with the Prometheus Operator pack installed. Use the URL exposed for port
9090 to populate the remoteWrite.url parameter.
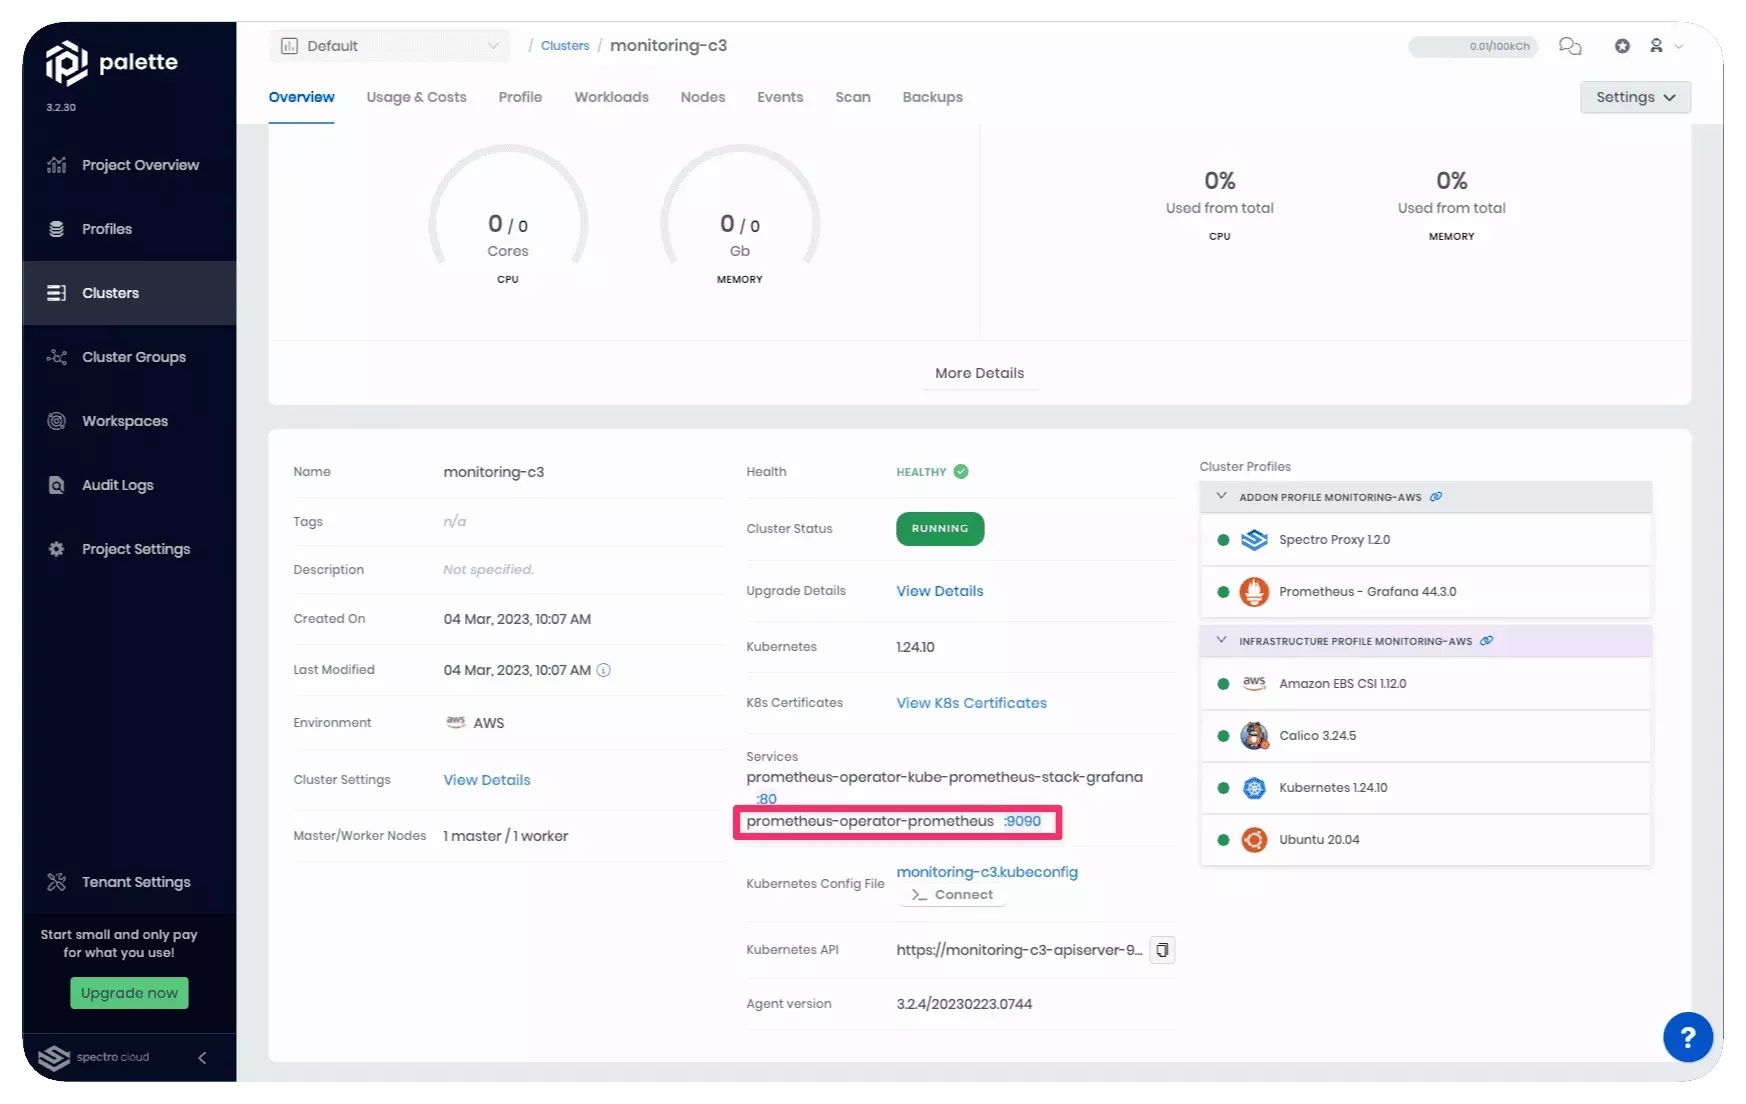
The Prometheus server URL must be in the format http://HOST:PORT/api/v1/write. Example:
http://a2c938972938b4f0daee5f56edbd40af-1690032247.us-east-1.elb.amazonaws.com:9090/api/v1/write
If the Prometheus server is configured with authentication, add the authentication parameters. Replace <USERNAME> and
<PASSWORD> with the actual credential values.
charts:
  prometheus:
    server:
      remoteWrite:
        - url: ""
          remote_timeout: "5s"
          basic_auth:
            username: "<USERNAME>"
            password: <PASSWORD>
Access the Grafana Dashboard
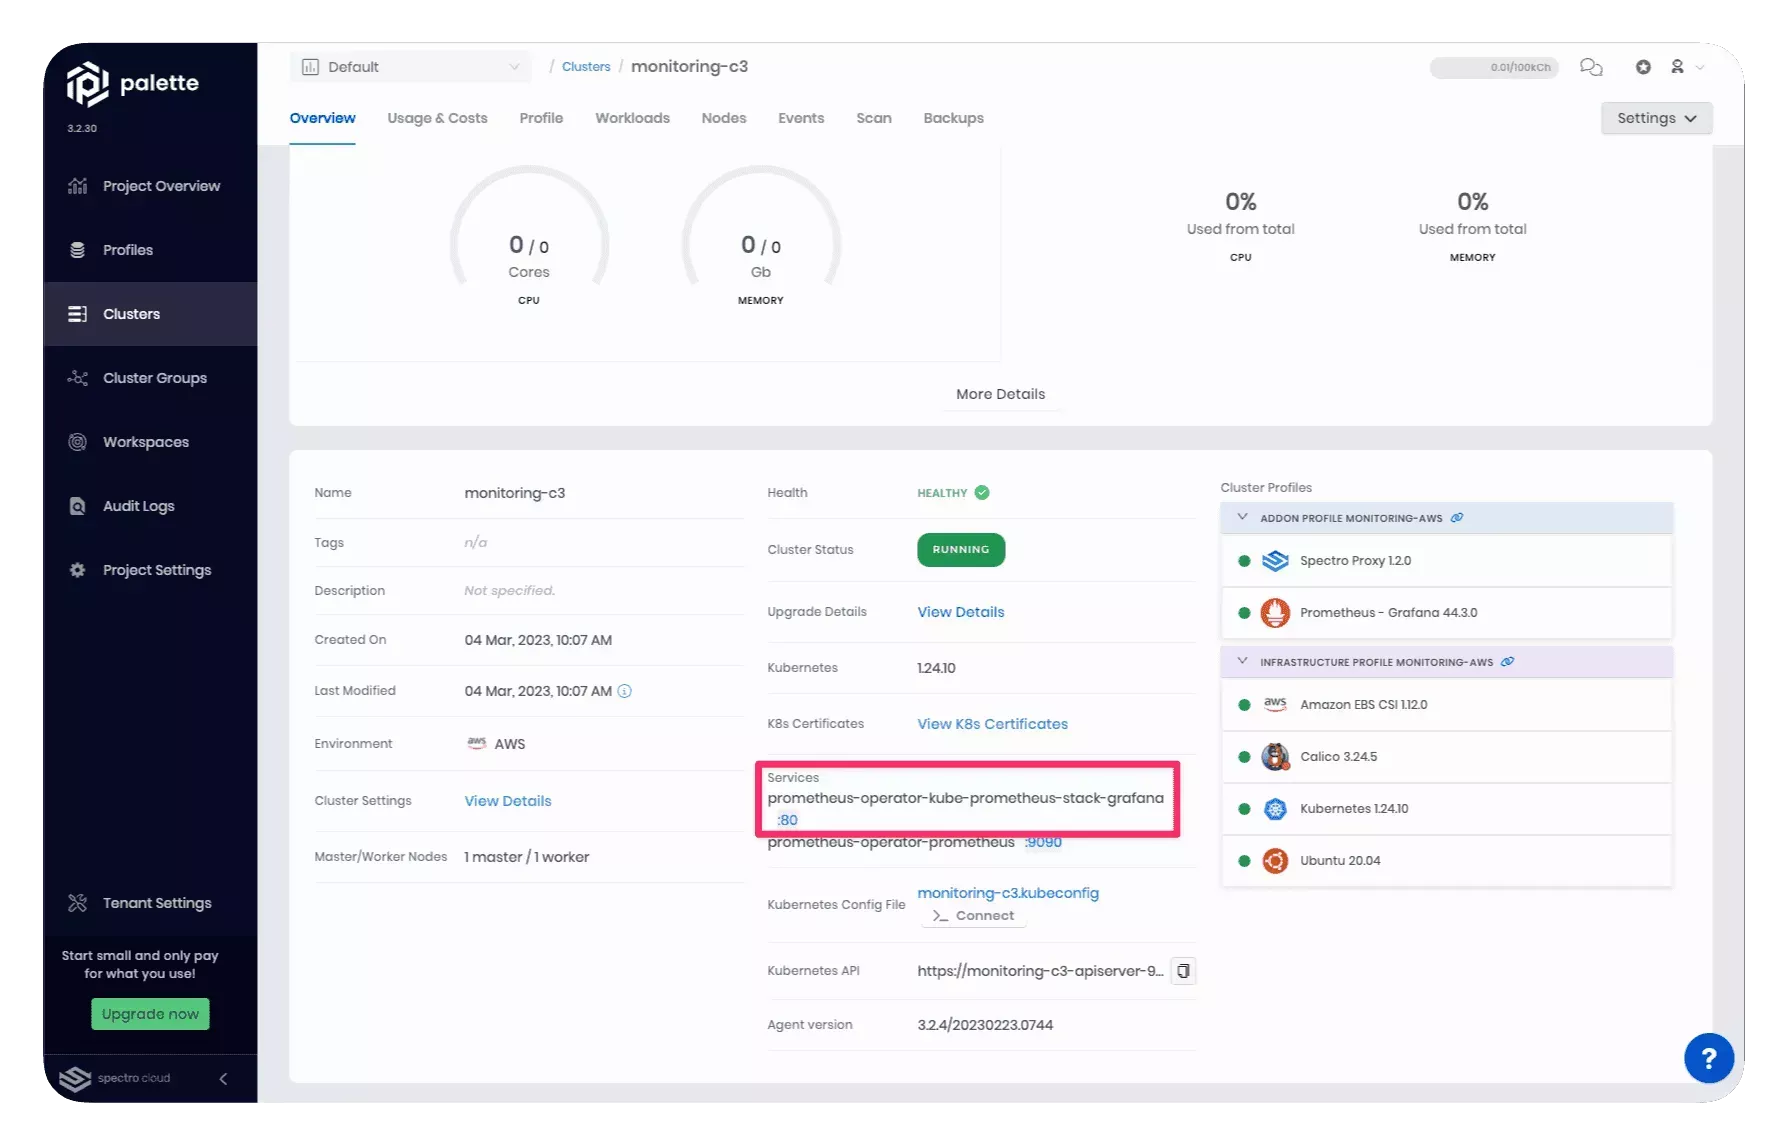
Log in to the Grafana dashboard to view and create dashboards. You can find the Grafana dashboard URL by reviewing the details of the Kubernetes cluster hosting the Prometheus server. Use the URL exposed by the prometheus-operator-kube-prometheus-stack-grafana service.
Palette exposes a set of Grafana dashboards by default. You can find the Spectro Cloud dashboards by navigating to Grafana's left Main Menu > Dashboards and expanding the Spectro Cloud folder.
The following dashboards are available by default:
-
Kubernetes/System/API Server: A view of the resources and status of the Kubernetes cluster hosting the Prometheus server.
-
Kubernetes/Views/Global: An aggregate view of all the resources used by Kubernetes clusters.
-
Kubernetes/Views/Namespaces: An aggregate view of all the resources used by a specific Kubernetes namespace.
-
Kubernetes/Views/Nodes: A view of all nodes with the Prometheus agent installed.
-
Kubernetes/Views/Pods: A view of all the pods in a node with the Prometheus agent installed.
Use the filters to narrow down the information displayed. All Palette dashboards include the project and cluster filter.
We encourage you to check out the Grafana tutorials and learning resources to learn more about Grafana.
Terraform
You can reference the Prometheus Agent pack in Terraform with the following data resource.
data "spectrocloud_registry" "public_registry" {
  name = "Public Repo"
}

data "spectrocloud_pack" "prometheus" {
  name         = "prometheus-agent"
  version      = "19.0.2"
  type         = "helm"
  registry_uid = data.spectrocloud_registry.public_registry.id
}